In One Chart: Stock-market bounce: Why it’s ‘too soon to go all in’ on buying the dip
A big stock-market bounce after an ugly January might reflect misplaced confidence in a previously tried-and-true trading strategy, a Wall Street analyst warned on Monday.
“After a tough markdown of stocks in January, some investors have shown interest in ‘buying the dip,” wrote Lisa Shalett, chief investment officer at Morgan Stanley Wealth Management, in a note. “While such moves have worked well for most of this business cycle, we think it’s too soon to go all in.”
It’s been a volatile start to 2022. At the close on Jan. 27, the S&P 500 index SPX, -0.25% was down 9.7% from its early January record high, leaving it just shy of correction territory — defined as a 10% pullback from a recent peak. The Nasdaq Composite COMP, -0.47% was down 15.7%, Shalett noted. The selloff came as investors began factoring in a much more aggressive round of rate increases and other tightening measures by the Federal Reserve in an effort to get inflation under control.
The Fed, at the conclusion of its Jan. 25-26 policy meeting, signaled that rate increases, likely beginning in March, were indeed on the way. Soon came the rebound, with the S&P 500 snapping back by 4% from its Jan. 27 low through Friday’s close, while the Nasdaq bounced 5.6%.
See: ‘This is not 1980’: What investors are watching as next U.S. inflation reading looms
Shalett said bulls were quick to latch on to technical factors pointing to an “oversold bottom,” and took comfort in historical data showing that tightening announcements by the Federal Reserve over the past 60 years have been precedents for stock-market rebounds.
Shalett acknowledged that history can be a useful guide and that most market cycles and regime shifts exhibit “rhyming” patterns with the past, but warned that each cycle is unique — and that the current one, as policy makers deal with the effects of the COVID-19 pandemic, could be particularly so.
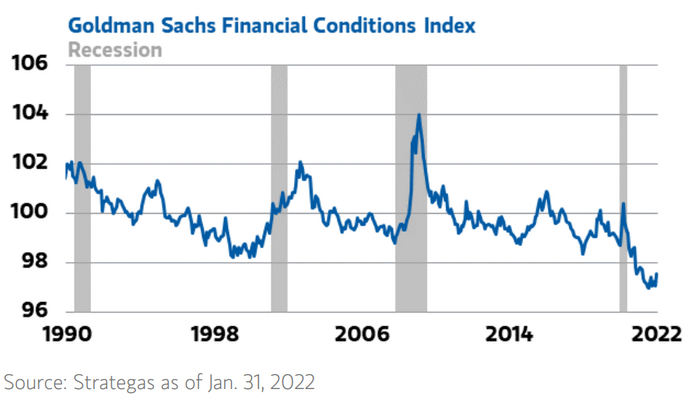
The picture is complicated, in part, by historically ample market liquidity (see chart below), she said, warning that the markets have yet to adjust to its eventual withdrawal.
Morgan Stanley Wealth Management
While interest rates have begun to reflect Fed guidance on rate increases this year, that isn’t the whole story. The chart above shows the Goldman Sachs Financial Conditions Index — higher readings mean tighter conditions. The gauge indicates market liquidity remains near its best level in three decades, roughly three standard deviations below the average of previous business cycles.
“Critically, although some argue that the Fed’s policy pivot to higher interest rates is priced into the bond market, we disagree,” she wrote. “Current rates may reflect Fed guidance as it stands, but tapering has not yet ended and financial conditions remain near the most accommodative level in history. We fear this ample liquidity may mask rising risks as multiple interdependent factors, including the actions of other central banks, may affect Fed policy.”
It will only be when rates start to rise and the Fed offers more detailed guidance on its plans for reducing its balance sheet that stocks will “better reflect the new reality,” Shalett wrote, arguing that, meanwhile, investors should be prepared for an environment that favors stock picking with a focus on “defensives and cyclicals with quality and undervalued cash flows.”
Need to Know: Crypto is like hydrogen, this JPMorgan strategist says, with valuations in both ahead of reality
Stocks struggled for direction in Monday’s session after the S&P 500 and Nasdaq on Friday booked their strongest weekly performance since late December. Major benchmarks flipped between modest gains and losses, with the Dow Jones Industrial Average DJIA, +0.10% up 45 points, or 0.1%, in afternoon trade, while the S&P 500 edged down 0.2% and the Nasdaq lost 0.4%.
Comments are closed.